
算子开发过程中,一个核心环节是借助于Nsight compute等成熟profiling工具来做性能分析。本文结合CUDA performance checklist中的例子,由浅入深来分析nsight compute工具如何指导开发者一步一步优化性能。:key:本文是个人NCU使用checklist。本文大量参考CUDA调优指南一系列教程,该教程十分详细,解释也很到位,推荐仔细学习。
引言
本文按照如下章节组织:
存储分析 (Memory Workload Analysis)
- 合并访存
- 共享内存
Occupancy
Roofline Model
metrics一览
Memory Workload Analysis
这一章节重点参考 NCU官方doc:memory char。使用的示例kernel如下:
1 | __global__ void copyDataNonCoalesced(float *in, float *out, int n) { |
存储模型
这一块的一个核心难点,是分清哪些概念是逻辑概念,哪些是物理实体概念。以下面NCU的存储模型图为例:
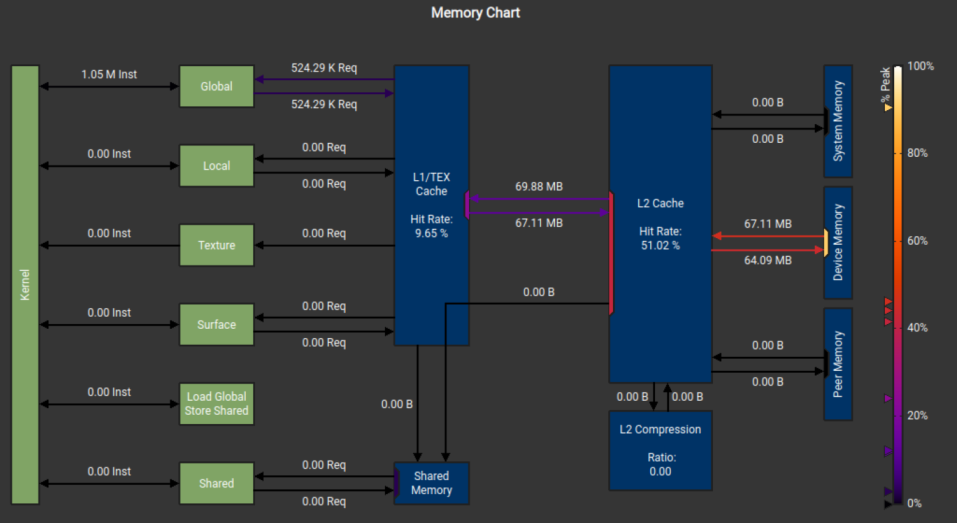
上图的概念汇总如下:
Kernel
Global &Local &Texture…
L1/L2/Shared/Device
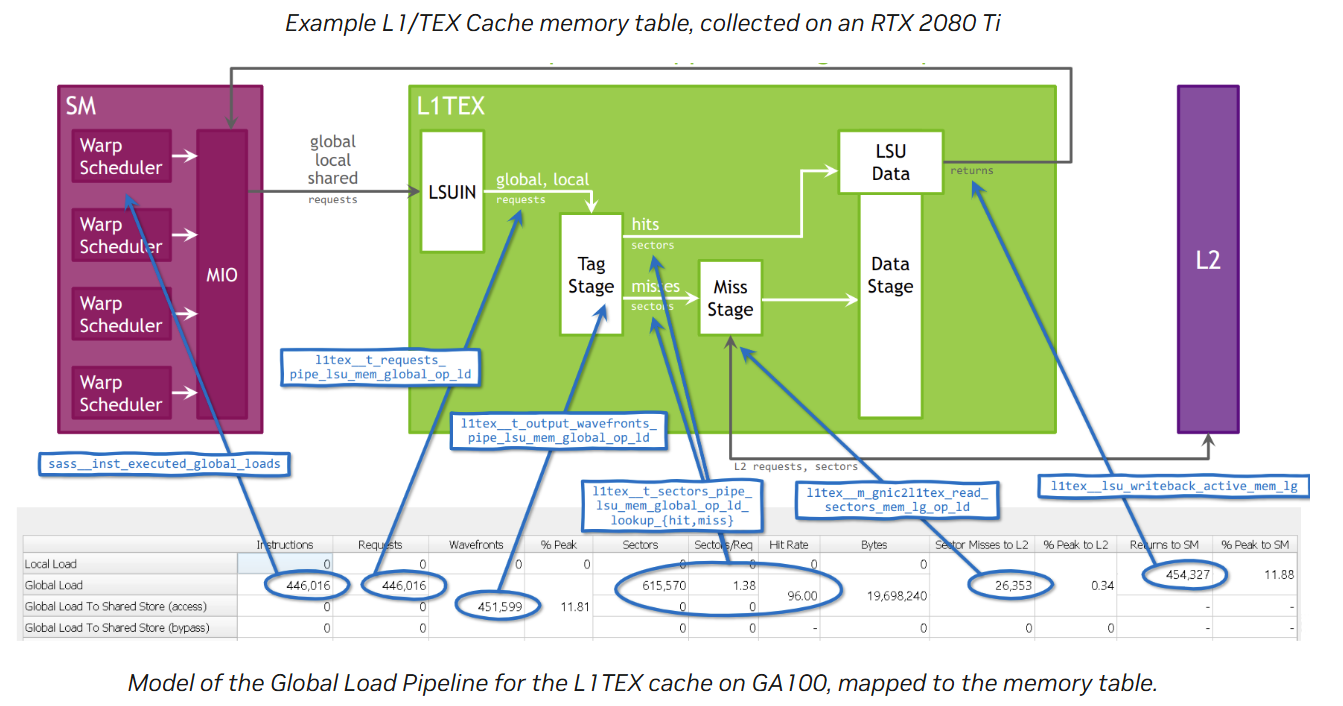
L1 cache
L2 cache
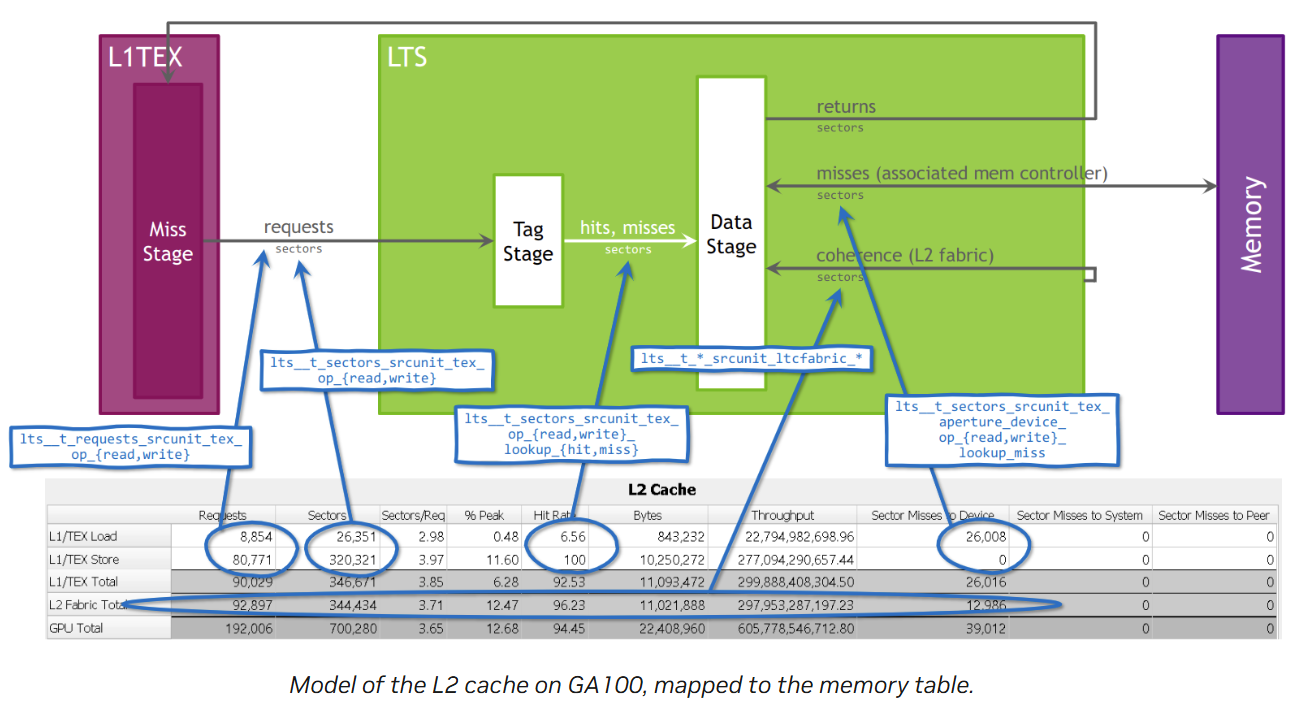
存储metrics解读
这一部分以copyDataNonCoalesced kernel为例,解读矩阵每一个值如何来的(:fire:一些有趣的算术问题)。
Occupancy
Occupancy定义如下:
实际影响Occupancy的因素有如下三条:
BlockSize
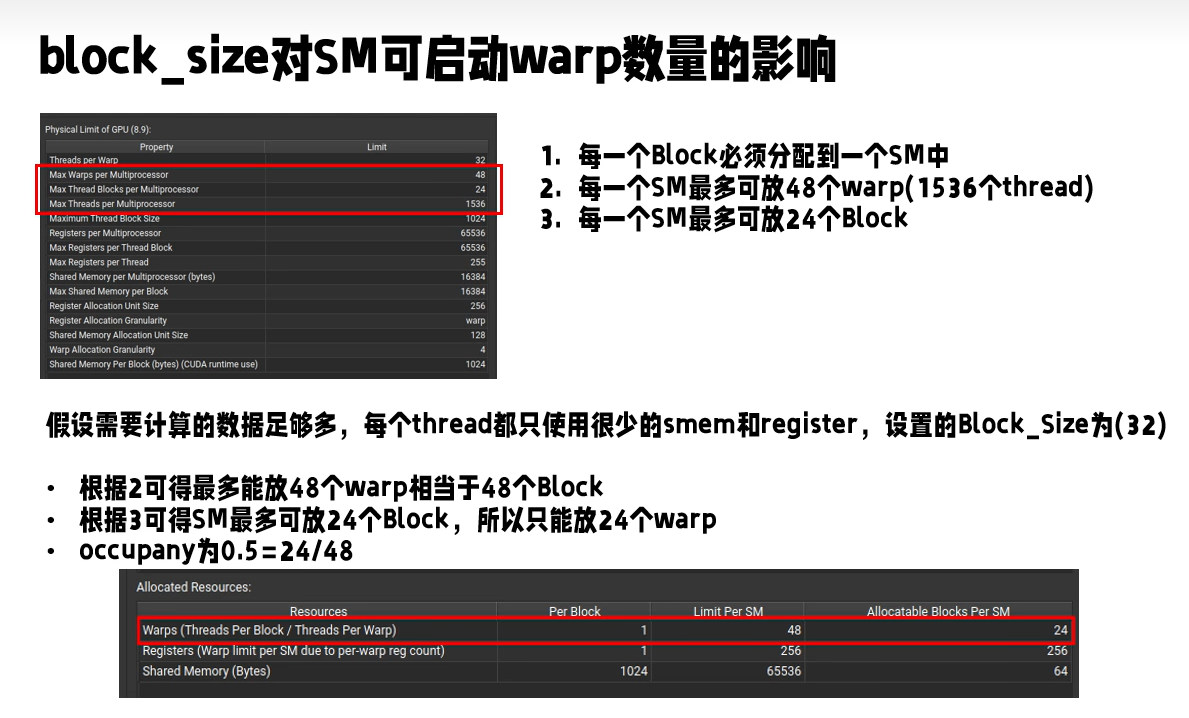
Register Per Thread
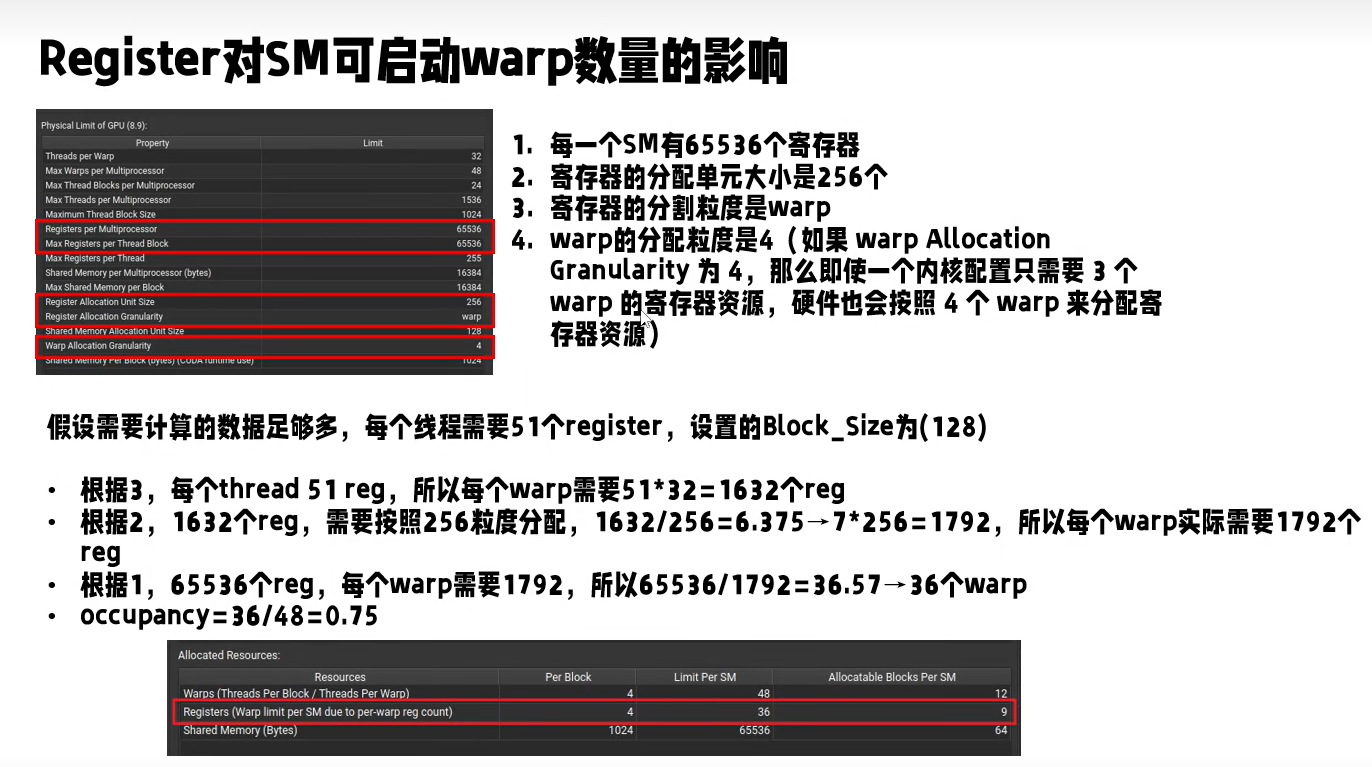
Shared memory Per Block
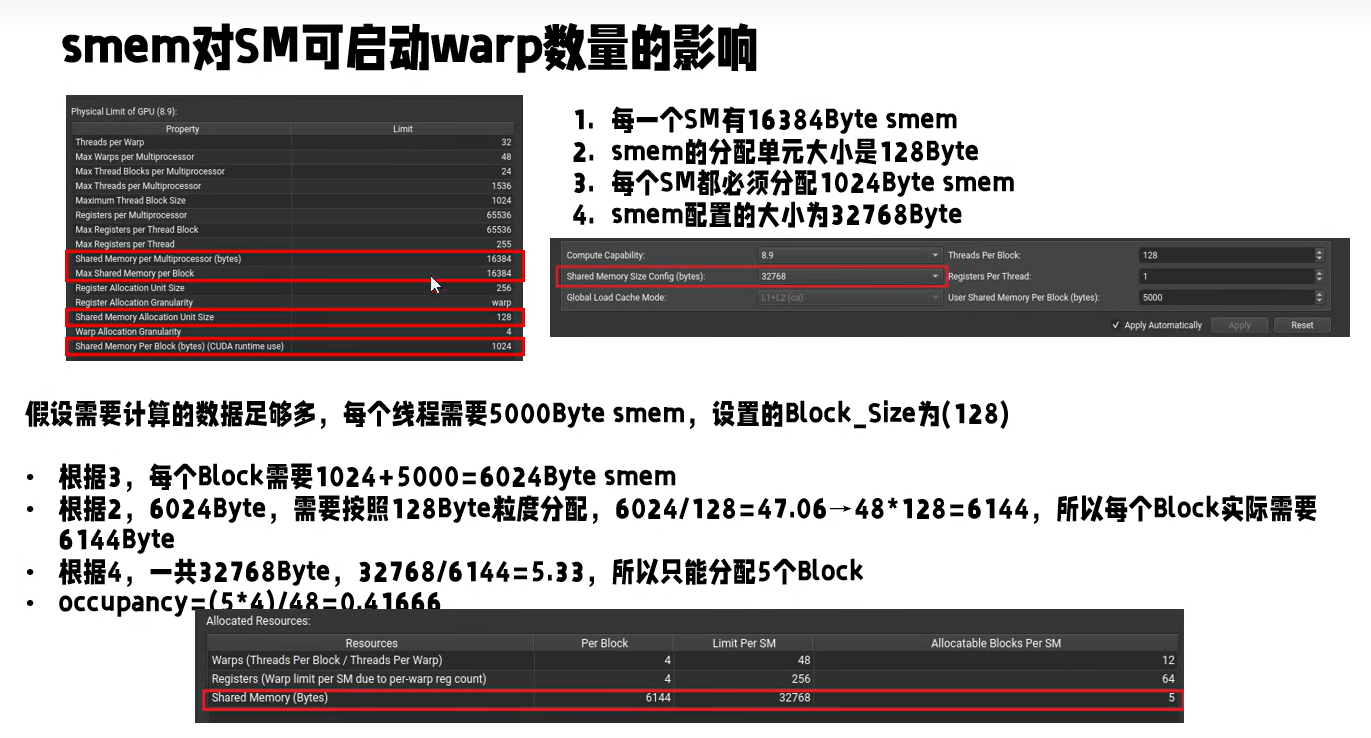
Shared Memory
分析smem行为,需要仔细研究如下表格:
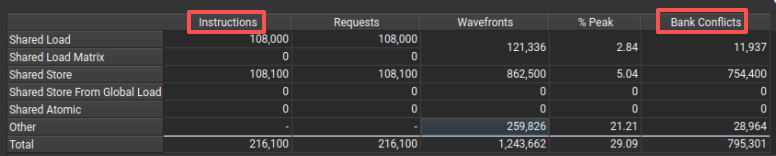
表格中我们比较关心的是instructions一节Bank Conflicts是如何计算的。结合如下程序进行详细分析:
1 | template <int BLOCK_SIZE> |
分析Bank Conflicts & Insts数目
要点:
- 一个warp是32 threads,需要分析清楚一个warp完成多少行的转置。
- threadBlocks大小默认为16x16,意味着写入的时候bank是有一个16间隔。
- 多少warp完成转置,取决于有多少行,不取决于多少列。比如:
- 2x16的块,则启动一个warp即可。
- 2x2的块,仍旧需要启动一个warp。
以上要点是我们接下来分析的基础,需着重理解。
我们尝试对两种不同的计算量做分析:
总计算量是16x16,这种情况下每个thread都有数据需要搬运处理,总共lanch一个threadBlock即可完成。示意图如下:
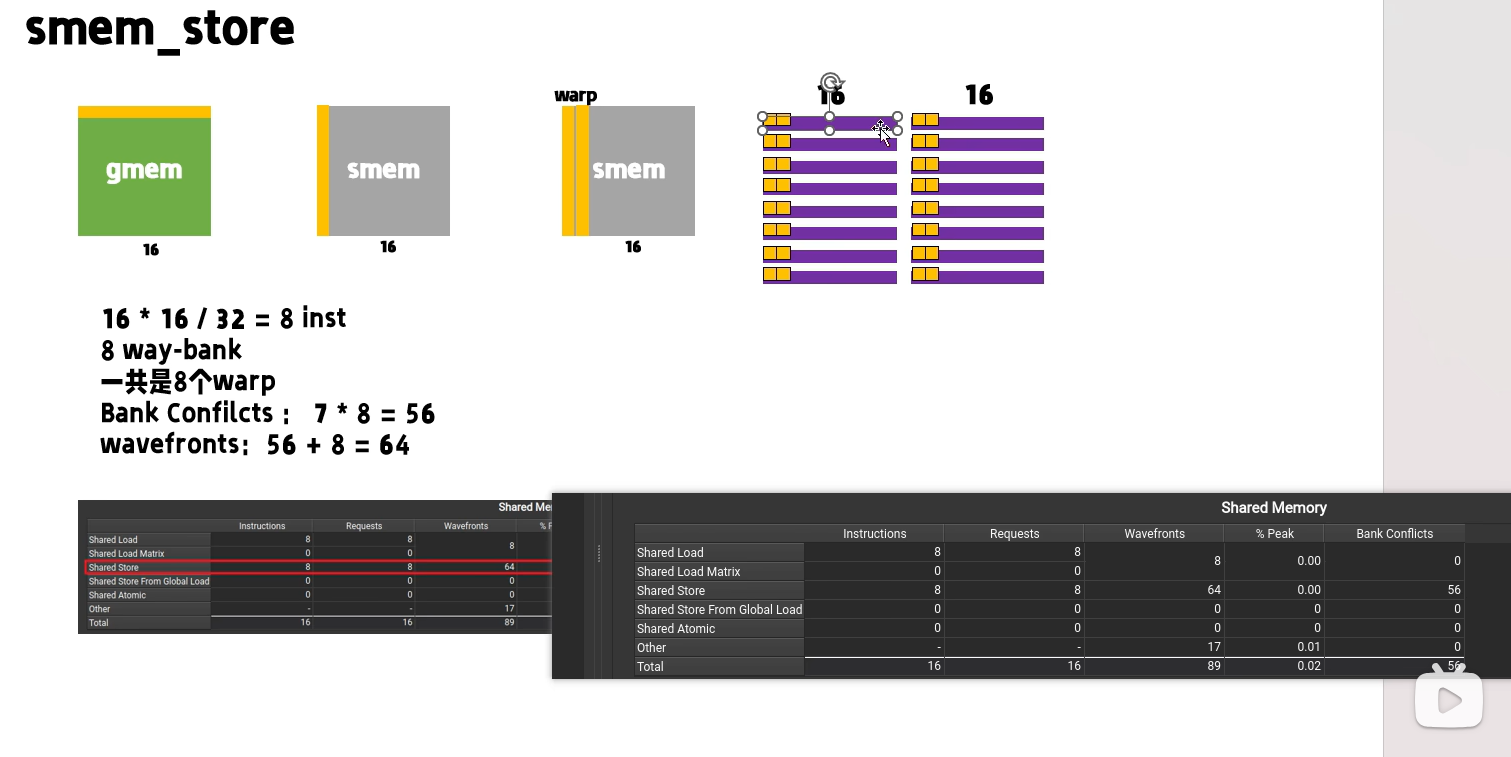
- inst分析:
- 这个case没有什么秘密,就是单纯 16 x 16 计算任务 除以 32 threads。
- BankConflicts分析:
- 一个warp 两行数据,共计8个warp完成。
- 做两行数据在smem的转置,原本的thread0和thread16访问相邻bank(0&1),thread1和thread17访问相邻bank(15&16),没有bank冲突。
- 冲突发生在thread2和thread18,这时候他们访问bank(0&1),此为一次冲突(注意:thread是并行的,所以0&1的冲突是同时)。
- 共计是8way,所以有8次冲突per warp。
- 最终冲突数:7 warp * 8 conlicts per warp = 56。
- inst分析:
总计算量是19x19,这种情况下需要launch四个threadBlocks,边缘threadBlocks存在大量线程五十可做 。示意图如下:
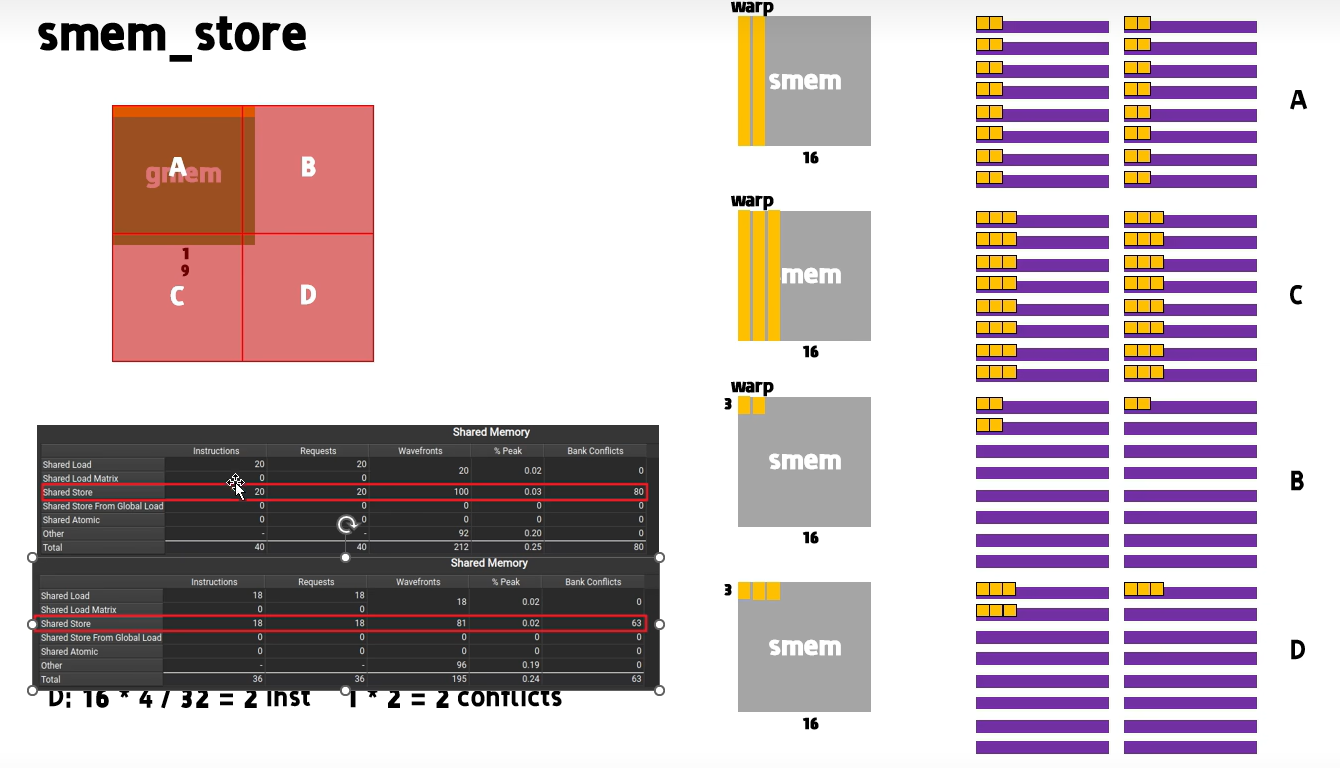
inst分析:
有了之前的基础,A矩阵不用再详细讲了,就是8inst。这里详细讲一下B,C,D。主要参考本小节开篇的要点:
- 对于B,块尺寸为16 x 3,仍旧相当于完整的16 x 16 ,inst为8。
- 对于C,块尺寸为 3 x 16,需要两个warp完成(虽然最后一个warp一般无事可做),inst为2。
- 对于D,和C同理,是2。
综上,为8 + 8 + 2 + 2 = 20个inst,和ncu看到的一样。这种情况下,inst数由行决定。
BankConflicts分析:
- A同理
- 对于C,总共两个warp执行,也是8way,所以bank conflict是2 * 7 = 14。
- 对于B,块大小是16 x 3,每个warp处理2 x 3,转置完存入smem是3 x 2,所以第一个2和最后一个2会有冲突,冲突为1。bank conflict是1 * 8 = 8。
- 对于D,块大小是3 x 3,转置为3 x 3, 所以为1(一个冲突) x 2(2个warp)。
总共14 + 56 + 8 + 2 = 80个冲突,符合ncu profiler的报告。
思考一下,为什么在2300 x 1500这个配置中,store(gmem到smem)共18100个inst,而load(smem到gmem)是18000个inst,差100个inst?
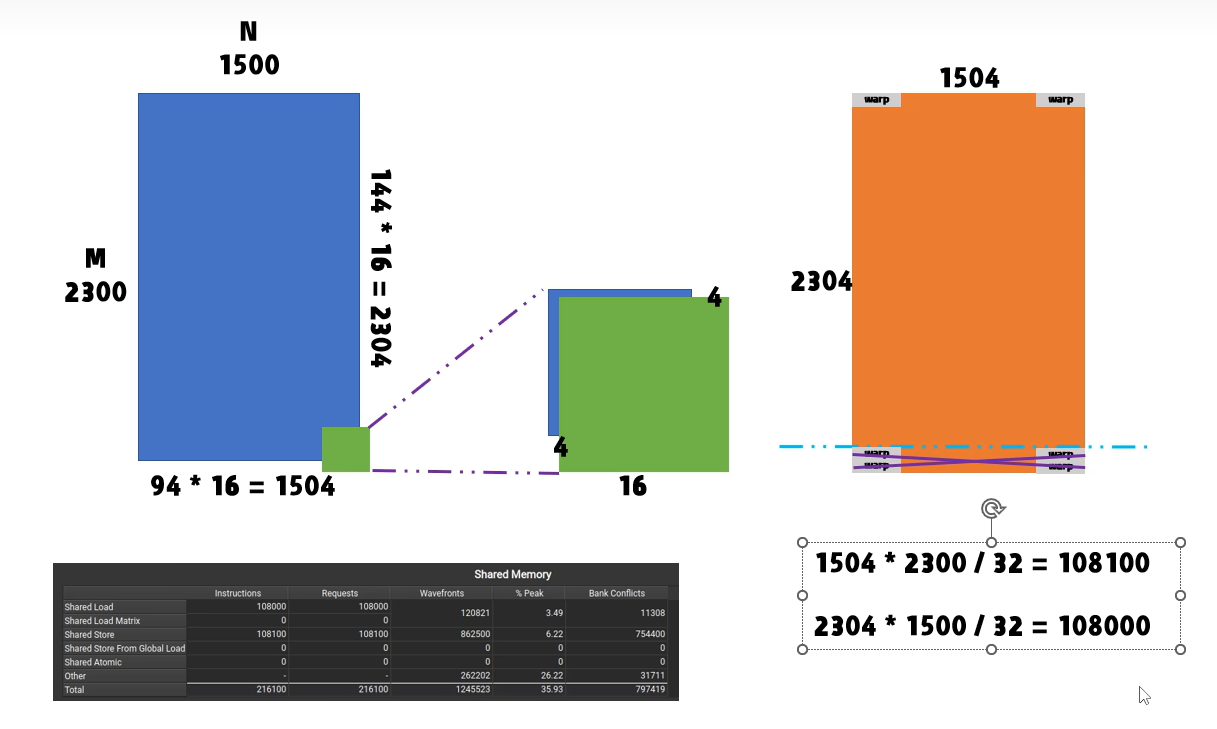
如上图所示,对于store,需要将列数补为16的倍数(这里由于1504本身是32的倍数,所以行号不用补齐),而对于load,由于做了转置,原本的列变为行!!!
Warp State Statistics & Scheduler Statistics & Source Counters
Warp Scheduler 原理
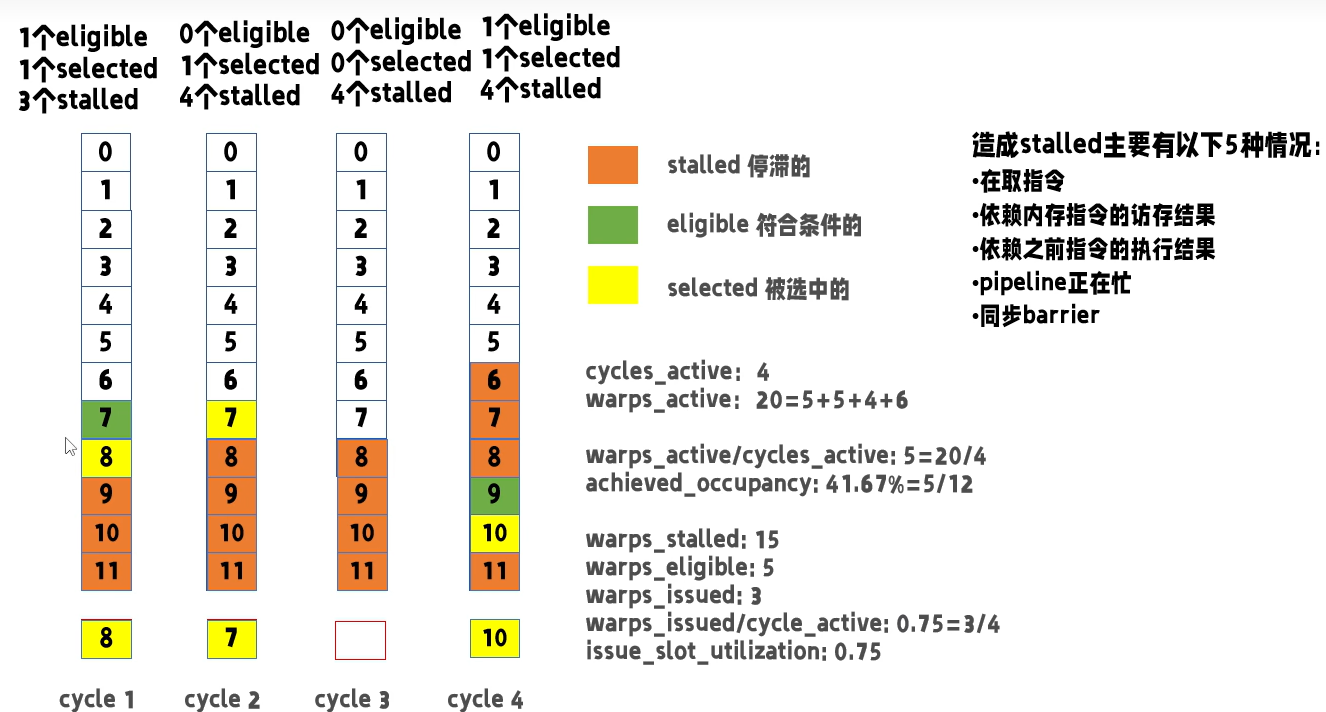
Warp Status Statistics
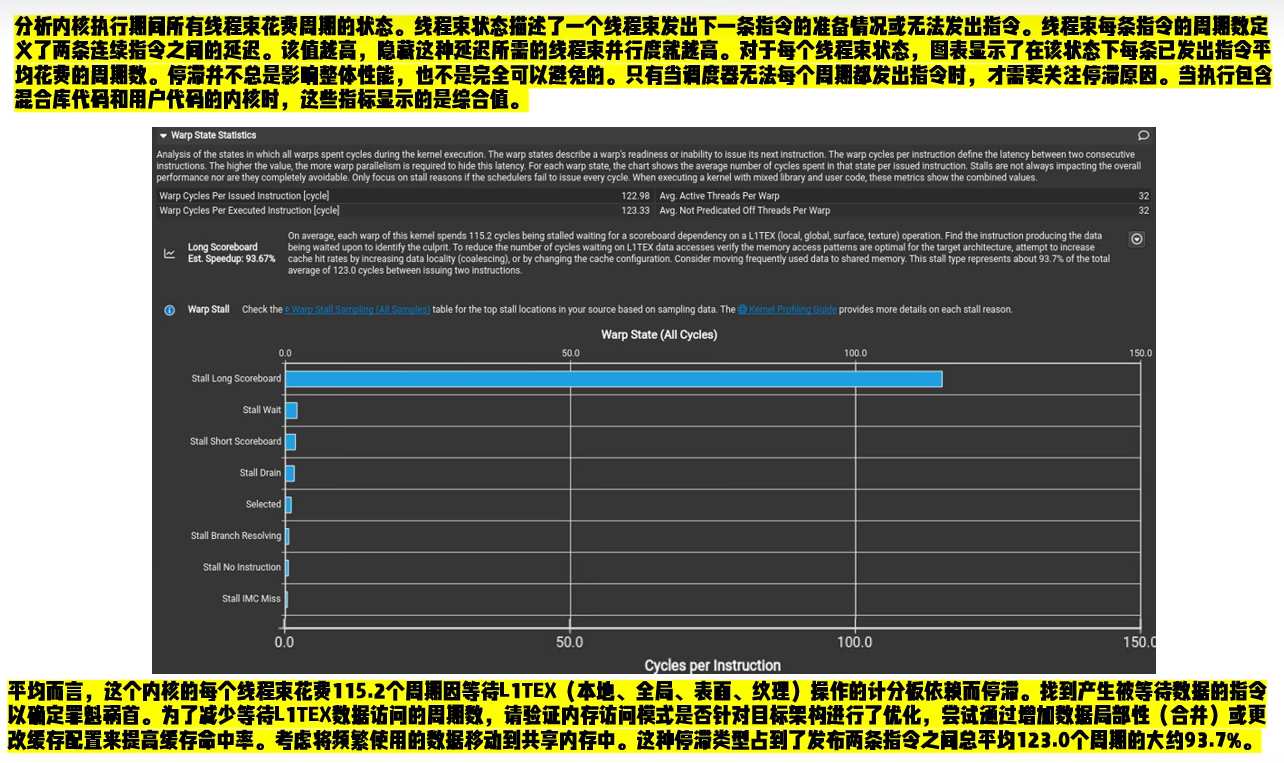
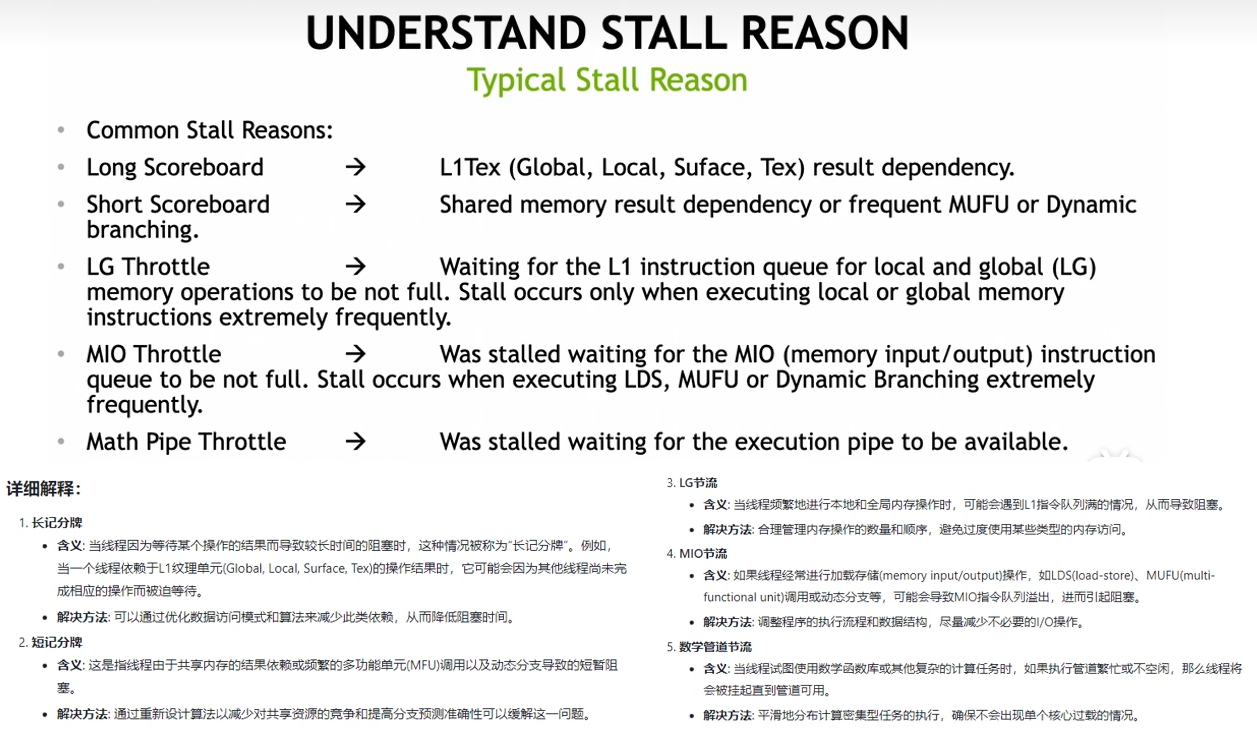
Stall Reason解读
这一部分建议更深入地参考CUDA进阶:深入理解Nsight System和Nsight Compute。
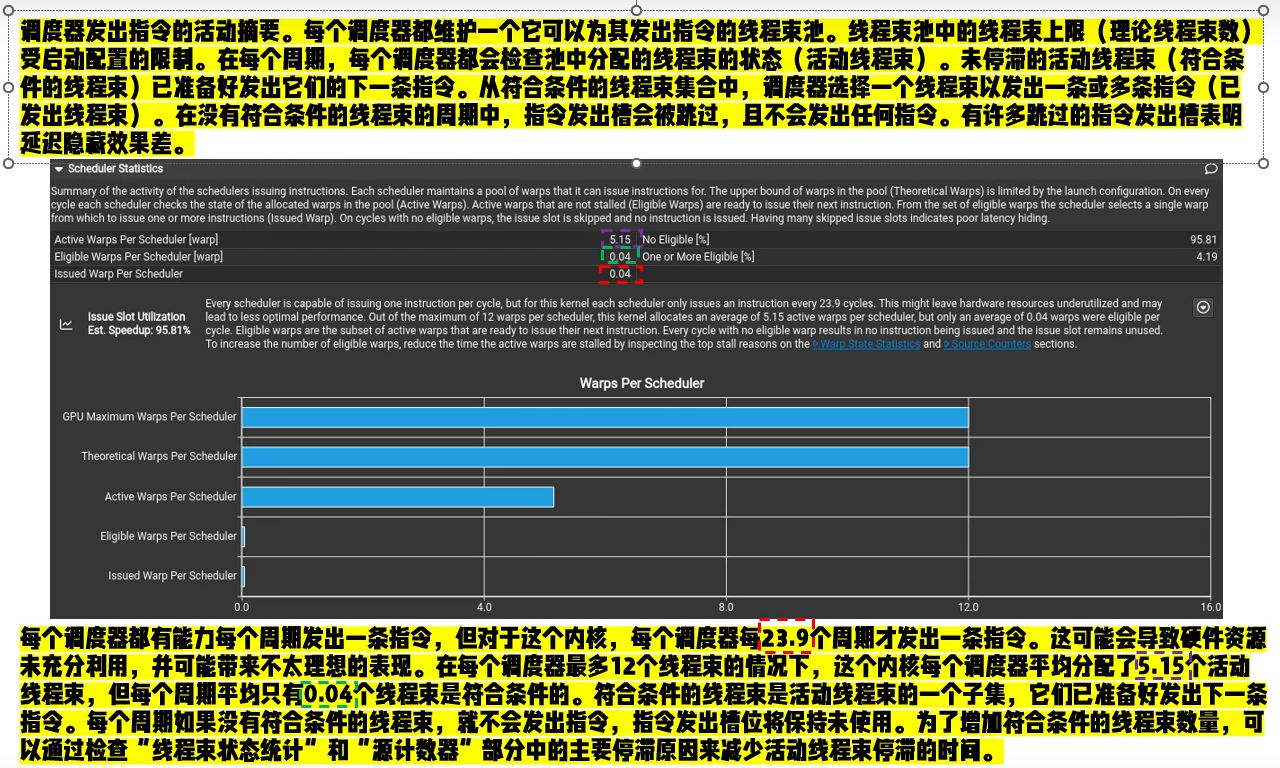
Scheduler Statistics
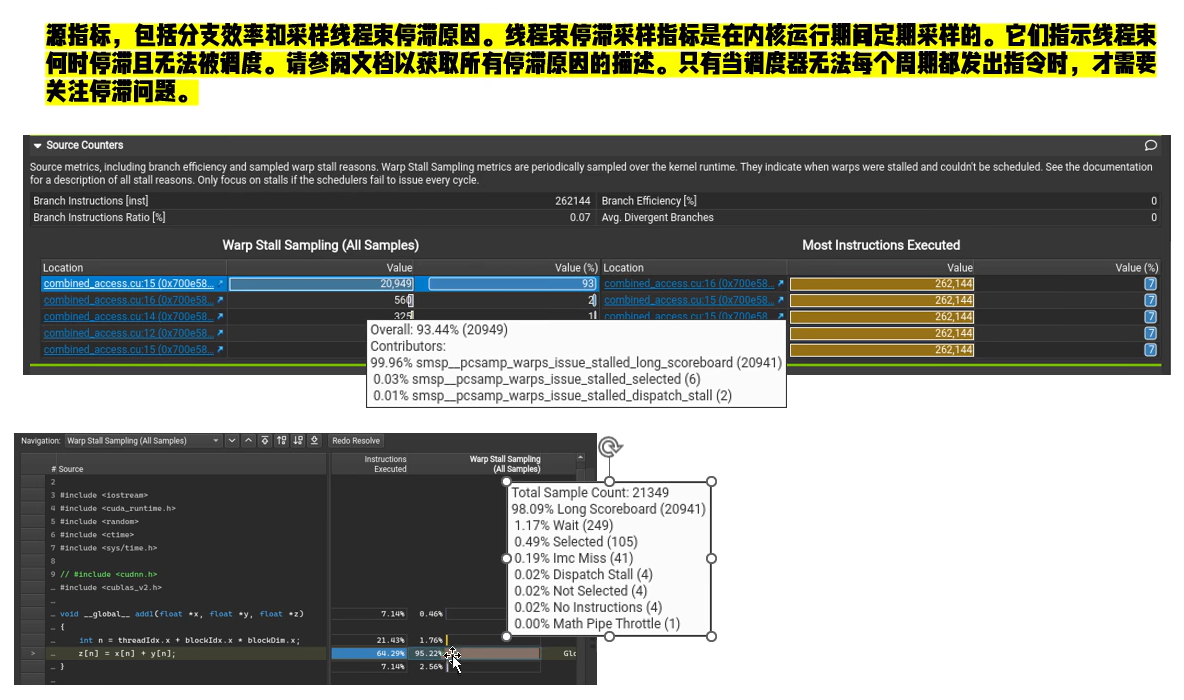
Source Counters
Roofline Model
参考资料
NCU 参考资料
- CUDA profiling guide
- GPU-MODE: Nvidia-profiling
- 新手性能分析参考
- 飞鸟视频 :fire::fire::fire:
- CUDA进阶:深入理解Nsight System和Nsight Compute